conceptviz
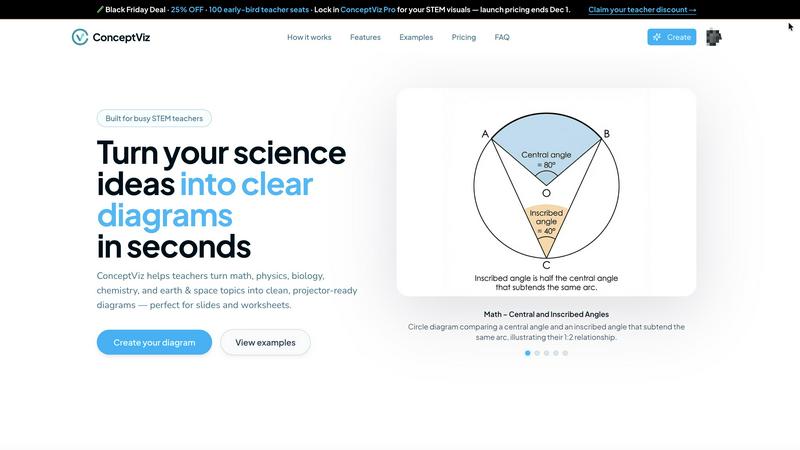
ConceptViz instantly creates clear, classroom-ready science and math diagrams from your simple description.
VisitPublished on:
December 2, 2025
Pricing:
About conceptviz
ConceptViz is a specialized AI tool designed to save educators, students, and researchers immense time by creating perfect, classroom-ready diagrams in seconds. It transforms complex scientific and mathematical concepts into clear, accurate, and projector-ready visuals with just a simple text description. Instead of spending hours searching for imperfect images online or struggling with complex drawing software, you can generate a tailored visual aid that matches your exact lesson plan. The tool understands the unique needs of a real classroom, producing diagrams with high contrast, legible labels, and minimal visual noise to ensure every student can see and understand, whether the diagram is on a screen or a printed handout. It covers a wide range of STEM subjects including Physics, Biology, Chemistry, Earth & Space, and Math, with presets tuned for different grade levels from elementary school to university research. Built for ultimate practicality, ConceptViz allows you to drop generated images directly into your existing lesson slides, worksheets, and assessments, ensuring your teaching visuals are always precise, professional, and effective.
Features of conceptviz
Subject & Grade Level Presets
ConceptViz comes with quick-start presets for core STEM subjects like Physics, Biology, and Chemistry, as well as Math and Earth & Space. These presets are finely tuned for real classroom use, aligned with U.S. grade bands from elementary to high school. This means you don't need any design or drawing skills to get started. Simply select your topic and grade level, and the AI is primed to generate an age-appropriate and curriculum-relevant diagram, saving you from having to explain basic context every time.
Projector-Ready Clarity
Every diagram is engineered for maximum visibility in a classroom setting. ConceptViz automatically uses thick, legible lines and clear, readable labels against simple backgrounds with minimal visual noise. This thoughtful design ensures diagrams stay sharp and understandable from the front row to the back of the room, whether displayed on a classroom projector or a smart board, eliminating squinting and confusion.
Slide & Worksheet Friendly Format
The tool is built to integrate seamlessly into your existing workflow. Diagrams are generated in a widescreen aspect ratio perfect for presentation slides like PowerPoint or Google Slides. They also come with clean white or light backgrounds ideal for printing on worksheets or handouts. You can download high-resolution PNG images and paste them straight into your teaching materials without any need for tedious resizing or reformatting.
Time-Saving Prompt Reusability
ConceptViz helps you build a personal library of visual assets. Once you craft the perfect text prompt to generate a diagram for a specific concept, you can save and reuse it across different classes, sections, or semesters. This consistency saves prep time and ensures you always have a reliable, high-quality visual that matches exactly how you teach a particular topic, year after year.
Use Cases of conceptviz
Creating Lesson Plan Visuals
Teachers can quickly generate custom diagrams to illustrate key points in their daily lesson plans. For example, a middle school science teacher can type "photosynthesis process with labeled chloroplast" and get a clear, accurate diagram to embed in their slides, making abstract concepts tangible and engaging for students without spending hours on preparation.
Enhancing Student Worksheets and Assessments
Educators can use ConceptViz to produce precise, uncluttered diagrams for inclusion in quizzes, tests, and homework assignments. A high school physics teacher can generate a specific free-body diagram for an incline plane problem, ensuring the visual on the test is perfectly aligned with the lesson material and is easy for students to interpret.
Supporting Student Projects and Reports
Students from middle school to university level can use the tool to create professional-quality figures for their science fair projects, research papers, or presentation slides. A biology student can easily generate a detailed, labeled sequence of mitosis stages for their report, helping them communicate their understanding clearly and professionally.
Aiding Academic Research and Publishing
Researchers and graduate students can utilize ConceptViz to draft clean, explanatory figures for papers, theses, or conference presentations. While not for final publication, it's perfect for quickly sketching out a concept, like a chemical reaction mechanism or a geological process, to use in drafts, lab meetings, or grant proposals to visually explain complex ideas.
Frequently Asked Questions
What subjects does ConceptViz cover?
ConceptViz is specialized for STEM education and covers a wide range of subjects including Physics, Biology, Chemistry, Earth & Space, and Mathematics. It offers presets and is tuned to generate accurate diagrams for concepts from elementary school basics all the way up to university-level research topics.
Do I need any design skills to use it?
No, you do not need any design or drawing skills whatsoever. ConceptViz is built specifically for educators and researchers, not graphic designers. You simply describe the diagram you need in plain English, and the AI handles the creation process, delivering a professional, classroom-ready visual.
Can I use the diagrams in printed handouts?
Absolutely. Diagrams are created with printing in mind. They feature clean white or light backgrounds, high contrast, and legible labels, making them perfect for photocopying or including in student worksheets, study guides, and printed assessments without losing clarity or detail.
Is there a free trial available?
Yes, you can try ConceptViz for free. You can sign in with a free account and start creating diagrams without needing a credit card. The free tier allows you to generate diagrams, including in 4K Ultra HD resolution, so you can fully test the tool's capabilities in your teaching or research workflow.
Similar to conceptviz


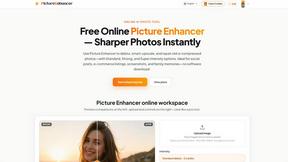
Photo to Excel
Turn table photos and screenshots into editable Excel files. Merge images, remove duplicates, preview free.


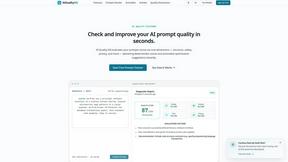
AIQualityHQ
AIQualityHQ helps you write better AI prompts instantly by checking for structure, safety, and privacy risks in your browser for free.

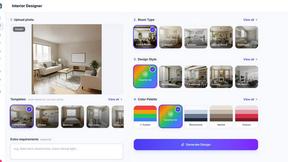
VideoAny PL
VideoAny lets you easily generate AI videos, images, and audio from text or photos all in one place.