Dividend Data
Instantly access 30+ years of stock data, including dividends and financials, directly in Google Sheets or Excel with our free add-in.
Visit
About Dividend Data
Dividend Data is a powerful tool that brings over 30 years of stock market data for more than 80,000 tickers directly into your Google Sheets and Microsoft Excel spreadsheets. Designed specifically for dividend and fundamental investors, it eliminates the need for API keys, coding, or tedious copy-pasting. With Dividend Data, you gain instant access to a wealth of information including dividends, yields, payout ratios, growth rates, financial statements, earnings, ratios, price history, and over 100 metrics. By simply typing a formula, you can pull live data into your spreadsheets, making it incredibly user-friendly. This tool is built by a dividend investor who understands the needs of fellow investors, ensuring that you have the resources necessary to make informed decisions without the high costs typically associated with institutional-grade data.
Features of Dividend Data
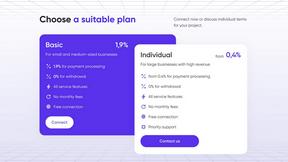
Free Tier with Monthly Credits
Dividend Data offers a generous free tier featuring 2,500 monthly credits, allowing users to explore the platform without the pressure of a trial expiration. This way, you can test the features and see how it fits your investment strategy.
Custom Functions for Dividend Investors
With 16 custom functions at your disposal, Dividend Data covers all the essential metrics that dividend investors need. Whether you are looking for dividend yields, payout ratios, or growth rates, these functions streamline data retrieval directly into your spreadsheets.
Extensive Historical Data
Dividend Data provides over 30 years of historical stock market data. This extensive database allows investors to conduct thorough analyses and track performance over time, enabling informed investment decisions.
Compatibility with Google Sheets and Excel
Dividend Data seamlessly integrates with both Google Sheets and Microsoft Excel. This compatibility ensures that you can access live data in your preferred spreadsheet software, making it easy to incorporate into your existing workflows.
Use Cases of Dividend Data
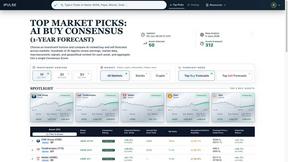
Analyzing Dividend Stocks
Investors can utilize Dividend Data to analyze a variety of dividend stocks. By using custom formulas, they can quickly access vital metrics such as dividend yields and payout ratios, which are crucial for evaluating potential investments.
Portfolio Management
Dividend Data allows users to track their dividend portfolios effortlessly. Investors can automatically link their portfolios to the tool, providing them with aggregate statistics and performance insights that save time and enhance decision-making.
Financial Research
With the AI-powered research assistant, users can conduct detailed financial analysis with ease. Dividend Data equips investors with the tools necessary to chat with the AI for insights, making complex analyses simpler and faster.
Historical Performance Review
Dividend Data's extensive historical information enables investors to review long-term performance trends of their investments. By examining past earnings and price histories, they can better understand how stocks have performed and strategize accordingly.
Frequently Asked Questions
How does Dividend Data integrate with Google Sheets and Excel?
Dividend Data integrates directly into Google Sheets and Microsoft Excel, allowing users to input specific formulas to retrieve live data without any coding or complex setups.
What kind of data can I access using Dividend Data?
With Dividend Data, you can access a wide range of stock market data including dividends, yield percentages, payout ratios, growth rates, financial statements, and over 100 additional metrics.
Is there a limit to the number of credits I can use?
Yes, the free tier provides you with 2,500 monthly credits. If you find that you need more data, you can explore additional pricing options available within the platform.
Who is Dividend Data designed for?
Dividend Data is specifically designed for dividend and fundamental investors who seek reliable, institutional-grade market data without the high costs associated with traditional financial services.
Similar to Dividend Data


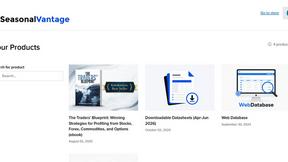
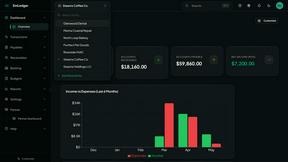
EmLedger
EmLedger lets you manage real double-entry accounting across all your entities for one flat fee, saving thousands compared to per-entity software.

Notesnchat
NotesnChat is your all-in-one app for managing tasks, notes, reminders, and communication effortlessly in daily life.