StatPecker
StatPecker transforms your data into quick insights and stunning visuals, making analysis easy and sharable.
Visit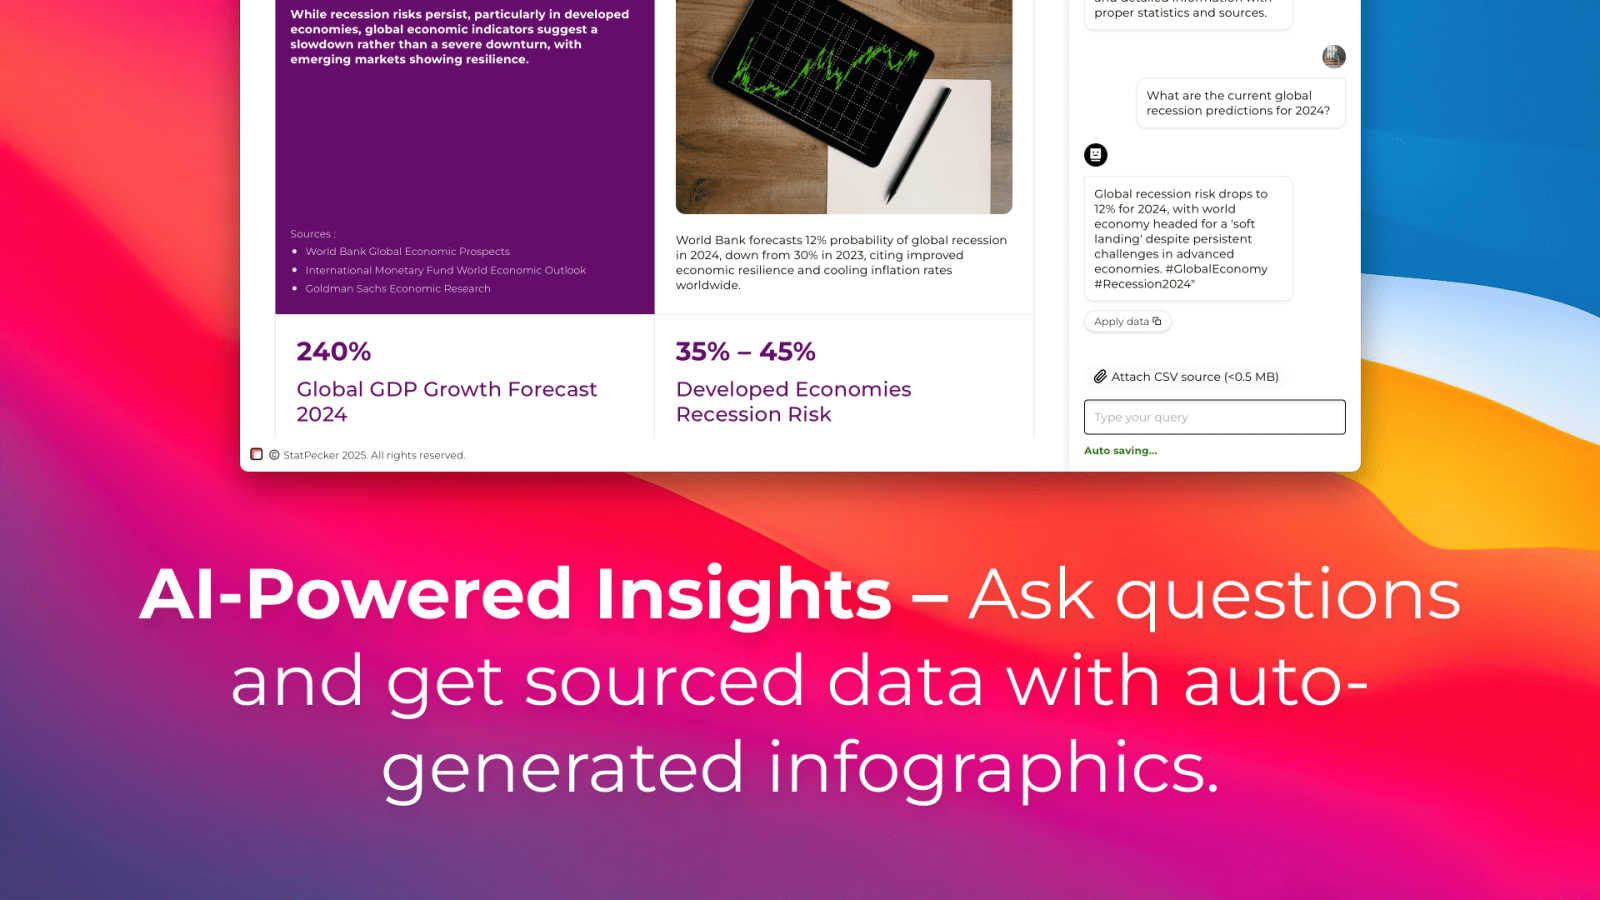
About StatPecker
StatPecker is your friendly AI assistant designed to transform dull numbers into stunning, impactful visuals effortlessly. It acts as a magic wand for your data, allowing you to simply ask a question, upload a spreadsheet, or describe what you wish to visualize. In an instant, StatPecker generates professional-grade infographics that cater to a wide range of users, including bloggers, business analysts, teachers, and marketers. The main value proposition of StatPecker lies in its ability to save you countless hours of manual work typically associated with complex design software or the high costs of hiring a designer. Its core mission is to simplify data storytelling, ensuring that insights are communicated clearly and effectively while boosting audience engagement, all without any technical hurdles. With features like interactive chart publishing and image downloading for reports, StatPecker is the all-in-one tool you need to make your data shine, all while starting for free.
Features of StatPecker
Ask Your Query
StatPecker allows you to gain instant insights by simply asking your question. Using AI technology, it provides validated answers without the need for complex tools or technical expertise. Just type your inquiry, and let StatPecker do the rest.
Publish & Embed
With StatPecker, you can create interactive visuals that can be effortlessly integrated into your blogs, articles, and websites. This feature ensures your audience engages with your content, enhancing their understanding of the data presented.
Upload & Analyze CSVs
StatPecker enables you to upload and analyze CSV files directly from your device. This feature allows you to extract key insights without the fuss of spreadsheets, making it easier to visualize and understand your data quickly.
Download & Use Anywhere
Export your stunning infographics as images for use in reports, presentations, and more. This feature provides flexibility, allowing you to utilize your visuals across various platforms and formats for seamless communication.
Use Cases of StatPecker
Data-driven Blogging
Bloggers can leverage StatPecker to turn statistical data into engaging infographics. By visualizing complex information, they can enhance their posts, making them more informative and appealing to readers.
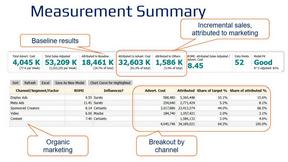
Business Analysis
Business analysts can utilize StatPecker to visualize sales trends and performance metrics. By generating clear and professional visuals, they can present findings to stakeholders in an understandable manner, aiding in decision-making processes.
Educational Purposes
Teachers can use StatPecker to create visual aids for their lessons. By transforming data into infographics, educators can help students grasp complex concepts more effectively, enhancing learning experiences.
Marketing Campaigns
Marketers can harness StatPecker to visualize campaign performance data. By presenting insights through interactive charts and infographics, they can effectively communicate results to their teams and clients, driving better marketing strategies.
Frequently Asked Questions
How does StatPecker ensure data privacy?
StatPecker prioritizes your data privacy by keeping everything on your device during analysis. All insights generated from local CSV files are processed without sending your data to external servers.
Can I use StatPecker without any design skills?
Absolutely! StatPecker is designed for users without any design background. You can create professional-looking infographics simply by uploading your data and asking your questions.
What types of files can I upload to StatPecker?
You can upload CSV files of up to 50 MB for analysis. This feature allows you to explore your data efficiently without the limitations of traditional spreadsheet software.
Is there a free trial available?
Yes! StatPecker offers a free tier that allows users to start creating infographics without any cost. You can explore its features and capabilities before deciding to upgrade to a paid plan for additional benefits.
Explore more in this category:
Similar to StatPecker


Photo to Excel
Turn table photos and screenshots into editable Excel files. Merge images, remove duplicates, preview free.


Kompy
Kompy gives you clean Walmart data as JSON through a simple REST API or MCP server, so you can build apps or AI agents that track prices, stock, and.

Kirkify
Transform any photo into hilarious Kirkified memes instantly with Kirkify AI's simple face swap tool.

Meme Picture
Meme Picture turns your selfies and pet photos into funny classic memes with AI, no login needed, and lets you download and share in seconds.
InContekst
InContekst helps you track and improve marketing across online and offline channels to boost conversions and long-term growth.