Fusedash vs StatPecker
Side-by-side comparison to help you choose the right tool.
Fusedash transforms raw data into intuitive dashboards and charts for instant insights and informed decision-making.
Last updated: March 4, 2026

StatPecker
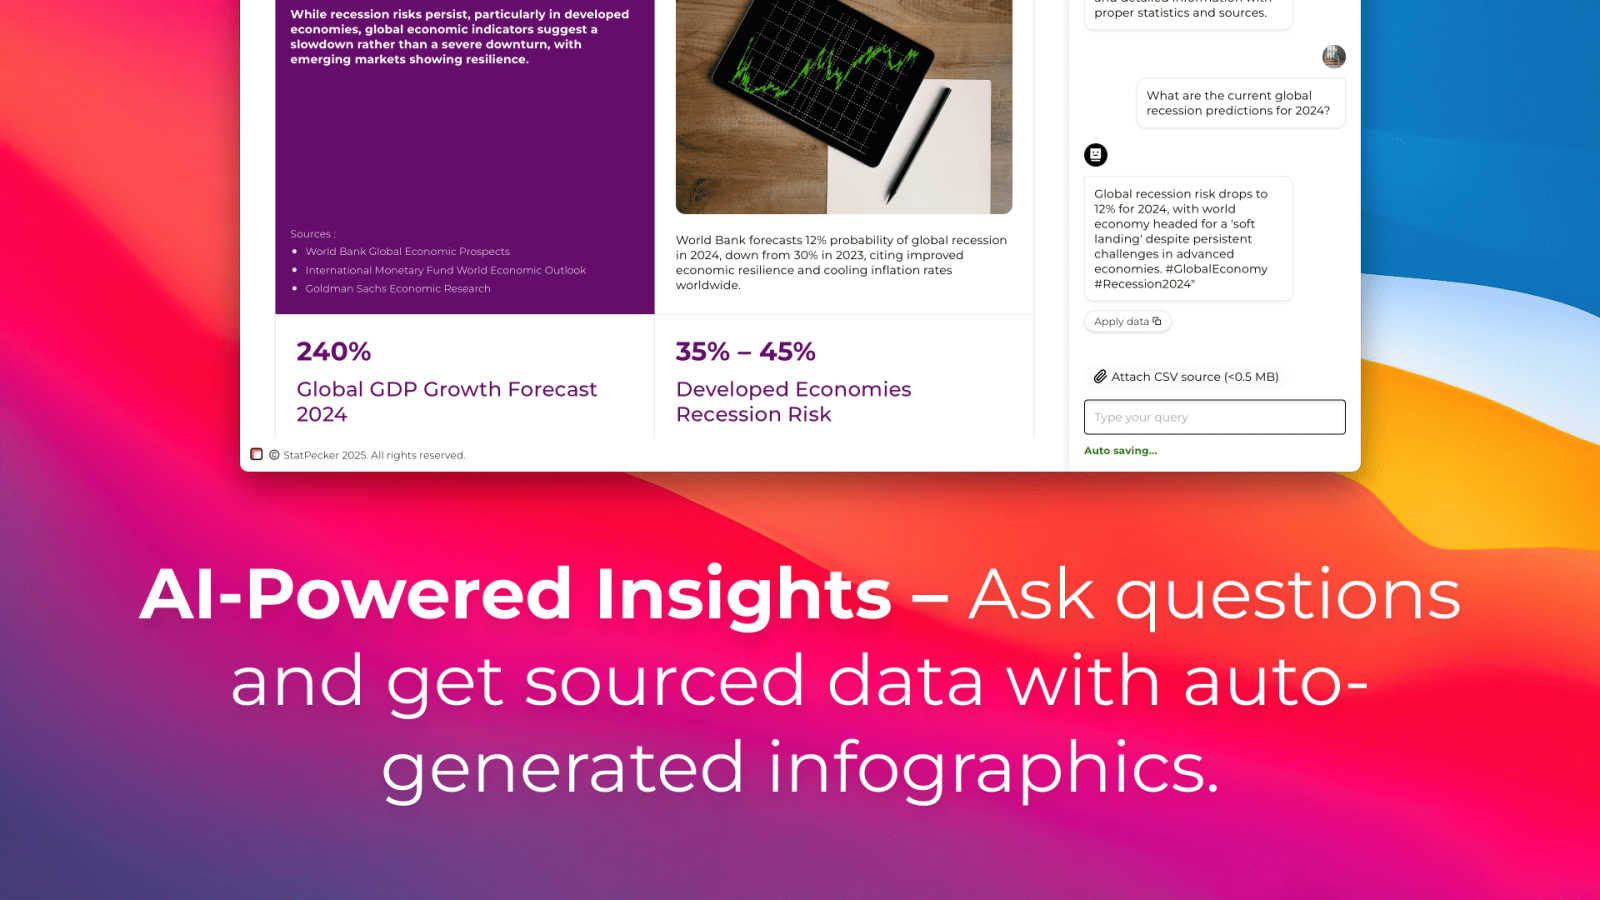
StatPecker transforms your data into quick insights and stunning visuals, making analysis easy and sharable.
Last updated: March 1, 2026
Visual Comparison
Fusedash

StatPecker
Feature Comparison
Fusedash
Flexible Views
Fusedash offers flexible views tailored for different audiences. You can easily convert the same dataset into dashboards, charts, maps, or report-style presentations, ensuring that each stakeholder sees the information that matters most to them without unnecessary back-and-forth communication.
AI Chart Generator
The AI Chart Generator in Fusedash allows users to create stunning visuals from CSVs or APIs in mere minutes. This feature helps you select the most suitable chart types, apply comparisons, and refine labels to accurately convey your data story, which can then be incorporated into dashboards or used as standalone visuals.
Dashboard Software
Fusedash combines dashboard monitoring with comprehensive reporting capabilities. This unique integration allows teams to share consistent views with stakeholders while adding context through storytelling sections, clarifying what has changed, why it is important, and what actions should be taken next.
Data Integrations
With Fusedash, you can seamlessly combine data from CSVs, APIs, and public datasets all within one platform. This feature simplifies data organization and ensures that various datasets can be reused across multiple charts, dashboards, and reports, reducing redundancy and enhancing efficiency.
StatPecker
Ask Your Query
StatPecker allows you to gain instant insights by simply asking your question. Using AI technology, it provides validated answers without the need for complex tools or technical expertise. Just type your inquiry, and let StatPecker do the rest.
Publish & Embed
With StatPecker, you can create interactive visuals that can be effortlessly integrated into your blogs, articles, and websites. This feature ensures your audience engages with your content, enhancing their understanding of the data presented.
Upload & Analyze CSVs
StatPecker enables you to upload and analyze CSV files directly from your device. This feature allows you to extract key insights without the fuss of spreadsheets, making it easier to visualize and understand your data quickly.
Download & Use Anywhere
Export your stunning infographics as images for use in reports, presentations, and more. This feature provides flexibility, allowing you to utilize your visuals across various platforms and formats for seamless communication.
Use Cases
Fusedash
Marketing Performance Monitoring
Marketing teams can utilize Fusedash to monitor campaign performance by creating dashboards that visualize key metrics such as conversion rates, customer engagement, and ROI. This allows for timely adjustments based on real-time data insights.
Financial Reporting
Finance departments can leverage Fusedash for generating detailed financial reports. By integrating various data sources, teams can create comprehensive visualizations that provide insights into budget performance, spending patterns, and revenue forecasts.
Sales Analysis
Sales teams can benefit from Fusedash by building interactive dashboards that track sales performance across different regions and product lines. This enables quick identification of trends and areas for improvement, fostering data-driven decision-making.
Operational Efficiency Tracking
Operations teams can use Fusedash to monitor key operational metrics and performance indicators. With real-time visualizations, teams can identify bottlenecks and optimize processes, ultimately improving efficiency and productivity.
StatPecker
Data-driven Blogging
Bloggers can leverage StatPecker to turn statistical data into engaging infographics. By visualizing complex information, they can enhance their posts, making them more informative and appealing to readers.
Business Analysis
Business analysts can utilize StatPecker to visualize sales trends and performance metrics. By generating clear and professional visuals, they can present findings to stakeholders in an understandable manner, aiding in decision-making processes.
Educational Purposes
Teachers can use StatPecker to create visual aids for their lessons. By transforming data into infographics, educators can help students grasp complex concepts more effectively, enhancing learning experiences.
Marketing Campaigns
Marketers can harness StatPecker to visualize campaign performance data. By presenting insights through interactive charts and infographics, they can effectively communicate results to their teams and clients, driving better marketing strategies.
Overview
About Fusedash
Fusedash is an advanced AI-powered data visualization platform that simplifies the process of transforming connected data into actionable insights. It is designed for teams and organizations seeking to enhance their data reporting and analysis capabilities without the hassle of dealing with multiple disconnected tools. With Fusedash, you can create dynamic dashboards, interactive charts, detailed maps, and comprehensive narrative reports all within a unified workspace. The platform's main value proposition lies in its ability to ensure consistency and efficiency; by defining key metrics and KPIs once, you can easily reuse these definitions across various views and reports. This feature guarantees that all team members, from leadership to operations, are aligned and referencing the same trusted data. Fusedash is particularly beneficial for teams weary of tedious manual reporting cycles and discrepancies in data interpretations. It empowers users to monitor real-time data while also enabling deeper analysis by drilling down into specific segments, regions, or time periods. With integrated AI functionalities like natural language data chat and smart visualization assistance, Fusedash streamlines data exploration and reporting, making it accessible to all users and transforming raw data into a collaborative source of truth that drives informed decision-making.
About StatPecker
StatPecker is your friendly AI assistant designed to transform dull numbers into stunning, impactful visuals effortlessly. It acts as a magic wand for your data, allowing you to simply ask a question, upload a spreadsheet, or describe what you wish to visualize. In an instant, StatPecker generates professional-grade infographics that cater to a wide range of users, including bloggers, business analysts, teachers, and marketers. The main value proposition of StatPecker lies in its ability to save you countless hours of manual work typically associated with complex design software or the high costs of hiring a designer. Its core mission is to simplify data storytelling, ensuring that insights are communicated clearly and effectively while boosting audience engagement, all without any technical hurdles. With features like interactive chart publishing and image downloading for reports, StatPecker is the all-in-one tool you need to make your data shine, all while starting for free.
Frequently Asked Questions
Fusedash FAQ
What types of data can I connect to Fusedash?
You can connect various data sources to Fusedash, including CSV files, APIs, and public datasets. This flexibility allows you to consolidate your data into a single platform for comprehensive analysis and reporting.
How does Fusedash ensure data consistency across reports?
Fusedash enables users to define key metrics and KPIs once, which can then be reused across all views and reports. This standardization ensures that everyone in the organization is referencing the same trusted data, eliminating discrepancies.
Can I customize the dashboards and reports in Fusedash?
Absolutely! Fusedash provides customizable layouts, filters, and time ranges, allowing you to tailor dashboards and reports to meet the specific needs of different audiences or stakeholders.
Is there support for real-time data monitoring in Fusedash?
Yes, Fusedash offers a real-time interface that allows users to monitor data as it is updated. This feature ensures that teams have access to the most current information for informed decision-making.
StatPecker FAQ
How does StatPecker ensure data privacy?
StatPecker prioritizes your data privacy by keeping everything on your device during analysis. All insights generated from local CSV files are processed without sending your data to external servers.
Can I use StatPecker without any design skills?
Absolutely! StatPecker is designed for users without any design background. You can create professional-looking infographics simply by uploading your data and asking your questions.
What types of files can I upload to StatPecker?
You can upload CSV files of up to 50 MB for analysis. This feature allows you to explore your data efficiently without the limitations of traditional spreadsheet software.
Is there a free trial available?
Yes! StatPecker offers a free tier that allows users to start creating infographics without any cost. You can explore its features and capabilities before deciding to upgrade to a paid plan for additional benefits.
Alternatives
Fusedash Alternatives
Fusedash is an AI-driven data visualization platform that helps teams transform raw data into clear dashboards and charts, enabling them to make immediate, informed decisions. It fits into the Analytics & Data and Business Intelligence categories, providing a unified workspace where users can create decision-ready reports without the hassles of managing multiple disconnected tools. Users often seek alternatives to Fusedash due to various reasons such as pricing, specific feature requirements, or compatibility with existing platforms. When searching for an alternative, it's essential to consider factors such as ease of use, the ability to customize data visualizations, integration capabilities, and overall value for money to ensure you select a tool that meets your organization's unique needs.
StatPecker Alternatives
StatPecker is an innovative AI-driven tool that transforms raw data into visually appealing infographics, making analytics accessible for everyone. It belongs to the Analytics & Data category, helping users turn complex datasets into clear, engaging visuals without the need for advanced technical skills or extensive design knowledge. Users often seek alternatives to StatPecker for various reasons, including pricing, specific feature requirements, or compatibility with different platforms. When choosing an alternative, it's essential to consider factors such as ease of use, the ability to analyze and visualize data seamlessly, and any unique features that may enhance your experience. Look for a solution that aligns with your needs and helps you effectively communicate insights.