
Chart Echo
Chart Echo instantly finds historical chart patterns matching your current setup and shows you how they played out before.
Visit
About Chart Echo
Chart Echo is a powerful and user-friendly tool designed to help traders and investors make more informed decisions by tapping into the market's own history. The core idea is simple: markets move in patterns that repeat. A breakout, a sell-off, a consolidation period these chart shapes have occurred countless times before. Chart Echo takes the exact chart pattern you are looking at right now and searches through a massive database of roughly 450 million historical windows across stocks and crypto. It finds the moments in the past that looked most like your current setup. But the real magic happens next. Instead of just showing you similar shapes, Chart Echo overlays those historical matches on your chart in gold and reveals what happened after that point. You can see the aggregate outcome statistics, including how often the setup rose, fell, or went nowhere, the average move, and the typical drawdown. This gives you a clear, data-grounded picture of the odds, not just a guess. Chart Echo is for everyone, from active traders checking a setup before entering a trade to long-term investors wanting to sanity-check a breakout against decades of precedent, and crypto watchers looking for patterns in volatile markets. It is not a prediction or financial advice, but rather the market's own memory, organized so you can study precedent in seconds. The app is designed to be beginner-friendly with a guided five-step flow, and you can try it for free with no signup required. It is a tool that replaces noise and opinion with honest, historical data, helping you see how today's chart has played out before.
Features of Chart Echo
Historical Pattern Matching
Chart Echo searches its vast database of roughly 450 million historical windows to find chart patterns that closely resemble the one you are currently viewing. You simply pick a stock or crypto, set your timeframe, and the tool instantly scans decades of market data. It does not rely on complex indicators or custom scripts. Instead, it uses a sophisticated fractal matching algorithm to identify structural similarities in price action, giving you a ranked list of the closest historical echoes. Each match comes with a similarity score, so you can see exactly how strong the rhyme is between your current setup and the past.
Outcome Statistics and Overlay
This is the feature that sets Chart Echo apart. After finding your historical matches, the tool does not just show you the similar shapes. It overlays those past matches directly onto your current chart in gold, allowing you to visually compare the two. More importantly, it aggregates the future performance of all those historical matches. You get clear statistics on the outcome, including the probability of the setup going up, down, or sideways, the average percentage move, and the typical drawdown you might expect along the way. This transforms a visual similarity into actionable, data-driven insight.
Guided Five-Step Workflow
Chart Echo is designed to be incredibly easy to use, even for beginners. The entire experience is built around a single, guided path that takes you from start to finish in five clear steps. First, you choose your market by searching for a stock or crypto. Second, you set the timeframe and define how many candles make up your pattern. Third, you run the search and see a ranked list of matches. Fourth, you explore the "Echo" view, where a historical match is overlaid on your chart with full statistics. Finally, you can act on the information by saving your workspace, setting a reminder, or sharing a GIF. There is no blank canvas or confusing guesswork.
Share, Save, and Set Reminders
Chart Echo provides practical tools to help you integrate its insights into your trading routine. You can save your entire workspace, including your chart and its matched echoes, so you can come back to it later. The app also allows you to set reminders for your favourite charts, and it will notify you when a strong fractal projection prints. For quick collaboration or personal note-taking, you can share your analysis as a GIF or an image with friends or colleagues. These features ensure that the valuable precedent you discover is not lost and can be acted upon when the time is right.
Use Cases of Chart Echo
Pre-Trade Setup Validation for Active Traders
Before you take a trade, you want to know if your setup has a statistical edge. Chart Echo allows you to take the chart pattern you are watching and instantly see how similar setups have performed in the past. You can view the odds of success, the average profit target, and the typical drawdown. This helps you avoid taking setups with poor historical outcomes and gives you confidence in those that have a proven track record. It turns a subjective "this looks good" into an objective, data-backed assessment of the probabilities.
Sanity-Checking Long-Term Investment Decisions
Long-term investors often face a dilemma when a stock they hold breaks out to new highs or sells off sharply. Is this the start of a major trend or a false signal? Instead of relying on a single analyst's opinion, you can use Chart Echo to check the current price action against decades of historical precedent. By seeing how similar breakouts or sell-offs resolved in the past, you can make a more rational, less emotional decision about whether to hold, add to your position, or take profits. It provides a broader historical context that is invaluable for long-term portfolio management.
Pattern Analysis for Cryptocurrency Markets
Cryptocurrency markets are known for their dramatic and repetitive price movements, making them an ideal candidate for pattern matching. Chart Echo allows you to analyze Bitcoin, Ethereum, and other major cryptocurrencies against their own past structure or even across different assets. You can see if a current consolidation pattern in Bitcoin looks similar to one that preceded a major rally or a crash. This provides a unique edge in a market where technical analysis can be highly effective but is often clouded by hype and FOMO.
Studying Historical Precedent for Educational Purposes
Chart Echo is not just a trading tool; it is a powerful educational resource for anyone learning technical analysis. Instead of reading about theoretical patterns like "head and shoulders" or "double bottoms," you can see them play out in real historical data. You can search for any current chart and see how the market has rhymed with it in the past. This hands-on approach helps you internalize how patterns actually form and resolve, building a deeper, more intuitive understanding of market behavior without the need for expensive courses or complex textbooks.
Frequently Asked Questions
Is Chart Echo a prediction tool or financial advice?
No. Chart Echo is explicitly not a prediction tool and does not provide financial advice. It is a research and analysis tool that helps you study historical precedent. It shows you how similar chart patterns have performed in the past, giving you a statistical picture of potential outcomes. The tool is designed to organize the market's own memory so you can make your own informed decisions, but it cannot predict the future. Always do your own research and consider your own risk tolerance before making any trading or investment decisions.
How does Chart Echo find historical matches?
Chart Echo uses a proprietary fractal matching algorithm to find historical chart patterns. You start by selecting a stock or crypto and defining your current pattern by setting a timeframe and the number of candles. The tool then searches its database of roughly 450 million historical windows to find segments of price action that have a similar structural shape to your current pattern. It does not rely on standard technical indicators or custom scripts. The results are ranked by a similarity score, showing you which past patterns are the closest match.
Do I need to create an account to use Chart Echo?
No, you can try Chart Echo for free without creating an account or signing up. This allows you to get a feel for the tool and see the value it provides immediately. Creating a free account unlocks additional features, such as the ability to save your workspaces so you can come back to your analysis later. A premium subscription is also available, which adds features like Pro Mode, saved-setup reminders, intraday timeframes, alerts, and watermark-free exports.
What markets does Chart Echo support?
Chart Echo supports a wide range of markets, including stocks and cryptocurrencies. The tool searches across these asset classes to find historical matches, which means a pattern on a stock could potentially match a historical pattern on a cryptocurrency and vice versa. This cross-asset matching capability provides a broader and more diverse set of historical precedents than a tool that only looks within a single asset class. The specific list of supported tickers is available within the app.
Similar to Chart Echo

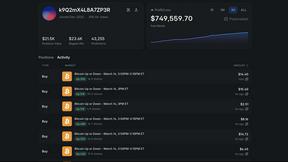
Polymarket Trading Bot For Crypto
Turn your crypto strategy into an automated bot that trades Polymarket's 5 and 15 minute markets for you.
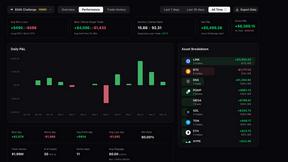
Trading Risk Lab
Take control of your trading with Trading Risk Lab, the ultimate tool for managing risk, sizing positions, and planning trades effectively.
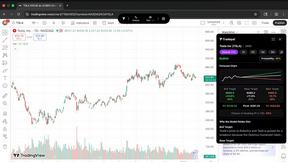
Tradepal
Tradepal transforms stock chart screenshots into actionable insights with AI-driven analysis and real-time forecasts.
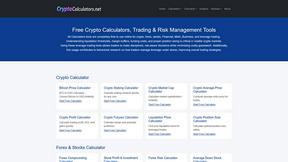
Free Crypto Calculators
Easily master crypto, forex, and stocks with our free calculators for smarter, risk-aware trading decisions.
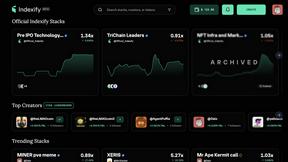
Indexify
Indexify connects you to expert crypto strategies for easy portfolio management and investment in curated Stacks.
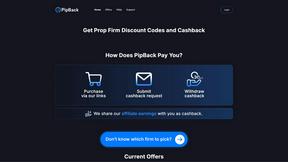
PipBack
PipBack gives you exclusive discount codes and real cashback on prop firm challenges to save you money.