Skippership vs StatPecker
Side-by-side comparison to help you choose the right tool.
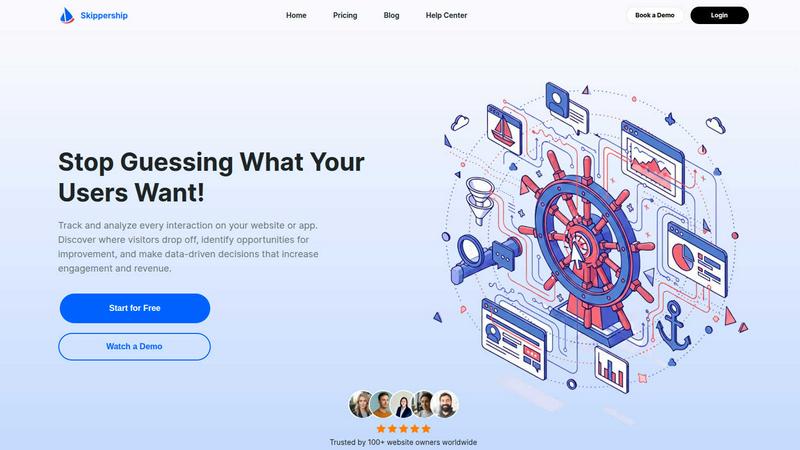
Skippership
Skippership reveals user behavior insights to enhance engagement and boost conversion rates effortlessly.
Last updated: March 1, 2026

StatPecker
StatPecker transforms your data into quick insights and stunning visuals, making analysis easy and sharable.
Last updated: March 1, 2026
Visual Comparison
Skippership
StatPecker
Feature Comparison
Skippership
Session Replays
Skippership offers session replay functionality that allows you to watch real user interactions with your site. This feature uncovers friction points, usability issues, and conversion blockers by providing a clear view of user journeys, making it easier for you to take confident, data-driven actions to improve your site.
Heatmaps
With Skippership’s heatmaps, you can visualize user engagement on your pages. This feature highlights where users click, scroll, and spend their time, enabling you to optimize underperforming areas and boost overall engagement and conversion rates.
Goal Tracking
Goal tracking in Skippership allows you to monitor key actions such as signups, purchases, and clicks effortlessly. This feature helps you measure performance, recognize patterns, and gain real-time insights into what drives conversions, giving you a comprehensive understanding of user interactions.
AI Analytics
Leverage AI-powered analytics with Skippership to uncover patterns in user behavior and make informed decisions quickly. This feature provides actionable insights that help strengthen user engagement and retention, leading to better business outcomes and improved user experiences.
StatPecker
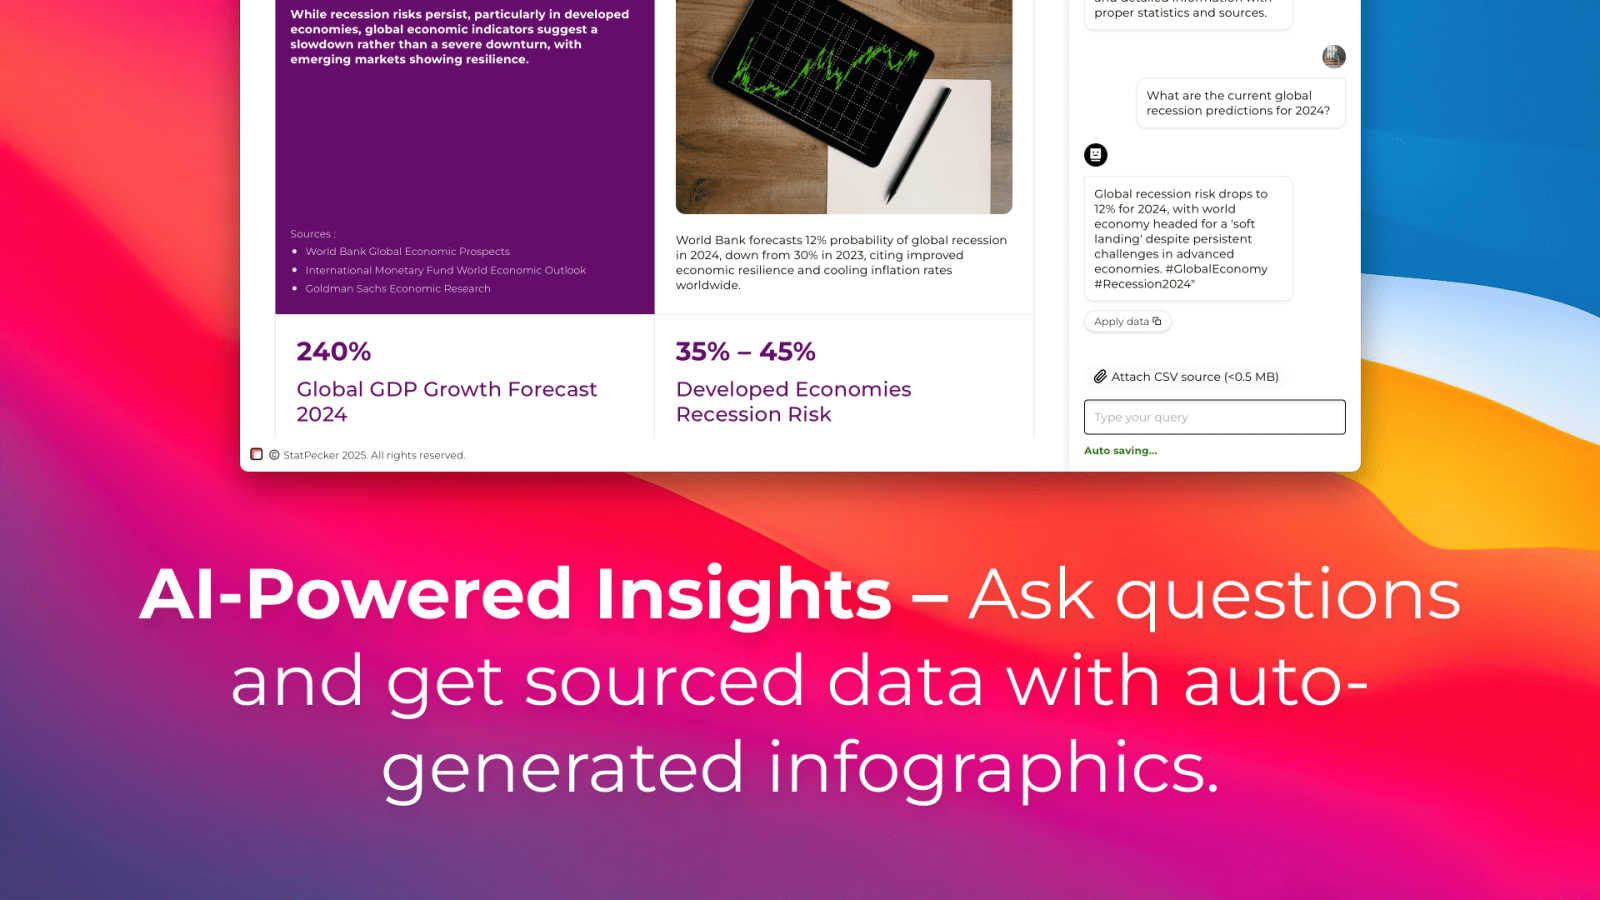
Ask Your Query
StatPecker allows you to gain instant insights by simply asking your question. Using AI technology, it provides validated answers without the need for complex tools or technical expertise. Just type your inquiry, and let StatPecker do the rest.
Publish & Embed
With StatPecker, you can create interactive visuals that can be effortlessly integrated into your blogs, articles, and websites. This feature ensures your audience engages with your content, enhancing their understanding of the data presented.
Upload & Analyze CSVs
StatPecker enables you to upload and analyze CSV files directly from your device. This feature allows you to extract key insights without the fuss of spreadsheets, making it easier to visualize and understand your data quickly.
Download & Use Anywhere
Export your stunning infographics as images for use in reports, presentations, and more. This feature provides flexibility, allowing you to utilize your visuals across various platforms and formats for seamless communication.
Use Cases
Skippership
Enhancing User Experience
By utilizing session replays and heatmaps, businesses can identify friction points in user journeys. This enables them to make necessary adjustments, ultimately leading to a streamlined user experience and higher satisfaction rates.
Increasing Conversion Rates
With goal tracking and AI analytics, companies can pinpoint which actions lead to conversions, allowing them to optimize their sales funnels and increase overall conversion rates effectively.
Reducing Cart Abandonment
Skippership helps in identifying exactly where users are dropping off during the checkout process. By addressing these issues through actionable insights, businesses can significantly reduce cart abandonment rates and recover lost sales.
Streamlining Marketing Strategies
Marketers can leverage the data gathered from Skippership to refine their strategies. By understanding user behavior and preferences, they can create targeted campaigns that resonate better with their audience, thus improving campaign effectiveness.
StatPecker
Data-driven Blogging
Bloggers can leverage StatPecker to turn statistical data into engaging infographics. By visualizing complex information, they can enhance their posts, making them more informative and appealing to readers.
Business Analysis
Business analysts can utilize StatPecker to visualize sales trends and performance metrics. By generating clear and professional visuals, they can present findings to stakeholders in an understandable manner, aiding in decision-making processes.
Educational Purposes
Teachers can use StatPecker to create visual aids for their lessons. By transforming data into infographics, educators can help students grasp complex concepts more effectively, enhancing learning experiences.
Marketing Campaigns
Marketers can harness StatPecker to visualize campaign performance data. By presenting insights through interactive charts and infographics, they can effectively communicate results to their teams and clients, driving better marketing strategies.
Overview
About Skippership
Skippership is an innovative AI-powered platform that provides deep insights into the behavior of your website or app visitors. It's specifically tailored for business owners, product managers, marketers, and UX designers who want to understand the reasons behind user drop-offs and optimize user experiences effectively. With Skippership, you no longer need to rely on guesswork; the platform simplifies complex data into clear, actionable insights. By offering tools such as session recordings, interactive heatmaps, and goal tracking, Skippership consolidates essential user data into a user-friendly dashboard. The standout feature is its AI capabilities, which autonomously reviews user sessions, identifies where users encounter difficulties—like checkout errors leading to cart abandonment—and provides practical solutions instantly. This empowers you to make data-informed decisions that enhance engagement, elevate conversion rates, and ultimately drive revenue growth. With a focus on simplicity, security, and quick setup, Skippership allows you to improve user experiences in a matter of minutes, not weeks.
About StatPecker
StatPecker is your friendly AI assistant designed to transform dull numbers into stunning, impactful visuals effortlessly. It acts as a magic wand for your data, allowing you to simply ask a question, upload a spreadsheet, or describe what you wish to visualize. In an instant, StatPecker generates professional-grade infographics that cater to a wide range of users, including bloggers, business analysts, teachers, and marketers. The main value proposition of StatPecker lies in its ability to save you countless hours of manual work typically associated with complex design software or the high costs of hiring a designer. Its core mission is to simplify data storytelling, ensuring that insights are communicated clearly and effectively while boosting audience engagement, all without any technical hurdles. With features like interactive chart publishing and image downloading for reports, StatPecker is the all-in-one tool you need to make your data shine, all while starting for free.
Frequently Asked Questions
Skippership FAQ
How does Skippership ensure data privacy?
Skippership prioritizes user privacy by adhering to GDPR and CCPA standards. It only processes necessary data, ensuring that personal or sensitive information remains protected throughout all interactions.
Is Skippership easy to set up?
Yes, Skippership is designed for fast and easy integration. With a no-code setup process, you can begin analyzing user behavior in just a few minutes, allowing you to focus on improving user experiences without lengthy delays.
What types of businesses can benefit from Skippership?
Skippership is beneficial for a wide range of businesses, including e-commerce websites, SaaS platforms, and any organization that seeks to understand user behavior better to optimize their websites or apps for improved engagement and conversions.
Can I integrate Skippership with my existing tools?
Absolutely! Skippership offers seamless integration with over 50 platforms, allowing you to unify your tech stack and streamline workflows without any hassle. This makes it easy to incorporate Skippership into your existing operations.
StatPecker FAQ
How does StatPecker ensure data privacy?
StatPecker prioritizes your data privacy by keeping everything on your device during analysis. All insights generated from local CSV files are processed without sending your data to external servers.
Can I use StatPecker without any design skills?
Absolutely! StatPecker is designed for users without any design background. You can create professional-looking infographics simply by uploading your data and asking your questions.
What types of files can I upload to StatPecker?
You can upload CSV files of up to 50 MB for analysis. This feature allows you to explore your data efficiently without the limitations of traditional spreadsheet software.
Is there a free trial available?
Yes! StatPecker offers a free tier that allows users to start creating infographics without any cost. You can explore its features and capabilities before deciding to upgrade to a paid plan for additional benefits.
Alternatives
Skippership Alternatives
Skippership is an innovative AI-powered platform that falls within the analytics and data category, designed to help website and app owners understand user behavior more effectively. By offering tools such as session recordings and interactive heatmaps, it empowers users to identify friction points in their digital experience, allowing for enhanced decision-making. However, many users may seek alternatives for various reasons, including pricing, specific feature requirements, or compatibility with their existing tech stack. When choosing an alternative to Skippership, look for platforms that offer similar capabilities in user behavior analysis, ease of use, and actionable insights that fit your unique business needs and objectives.
StatPecker Alternatives
StatPecker is an innovative AI-driven tool that transforms raw data into visually appealing infographics, making analytics accessible for everyone. It belongs to the Analytics & Data category, helping users turn complex datasets into clear, engaging visuals without the need for advanced technical skills or extensive design knowledge. Users often seek alternatives to StatPecker for various reasons, including pricing, specific feature requirements, or compatibility with different platforms. When choosing an alternative, it's essential to consider factors such as ease of use, the ability to analyze and visualize data seamlessly, and any unique features that may enhance your experience. Look for a solution that aligns with your needs and helps you effectively communicate insights.