Dividend Data vs Portfolio Genius
Side-by-side comparison to help you choose the right tool.
Dividend Data
Instantly access 30+ years of stock data, including dividends and financials, directly in Google Sheets or Excel with our free add-in.
Last updated: March 11, 2026
Portfolio Genius
Let AI manage your investments with smart analysis and automated trading for you.
Last updated: March 1, 2026
Visual Comparison
Dividend Data

Portfolio Genius
Feature Comparison
Dividend Data
Free Tier with Monthly Credits
Dividend Data offers a generous free tier featuring 2,500 monthly credits, allowing users to explore the platform without the pressure of a trial expiration. This way, you can test the features and see how it fits your investment strategy.
Custom Functions for Dividend Investors
With 16 custom functions at your disposal, Dividend Data covers all the essential metrics that dividend investors need. Whether you are looking for dividend yields, payout ratios, or growth rates, these functions streamline data retrieval directly into your spreadsheets.
Extensive Historical Data
Dividend Data provides over 30 years of historical stock market data. This extensive database allows investors to conduct thorough analyses and track performance over time, enabling informed investment decisions.
Compatibility with Google Sheets and Excel
Dividend Data seamlessly integrates with both Google Sheets and Microsoft Excel. This compatibility ensures that you can access live data in your preferred spreadsheet software, making it easy to incorporate into your existing workflows.
Portfolio Genius
Real-Time AI Portfolio Analysis
Portfolio Genius acts as your 24/7 analyst. It constantly monitors your holdings, processing real-time prices, company financials, market news, and the latest research. This powerful combination allows the AI to provide you with up-to-the-minute insights on your portfolio's health, potential risks, and opportunities based on current market conditions and your personal risk profile.
Smart Trade Suggestions & Management
Move from guesswork to guided action. Based on its continuous analysis, Portfolio Genius offers you clear, data-driven trade ideas. You can effortlessly log and track all your trades within the platform, gaining detailed insights into your trading patterns and performance over time. This feature helps you learn from your decisions and refine your strategy.
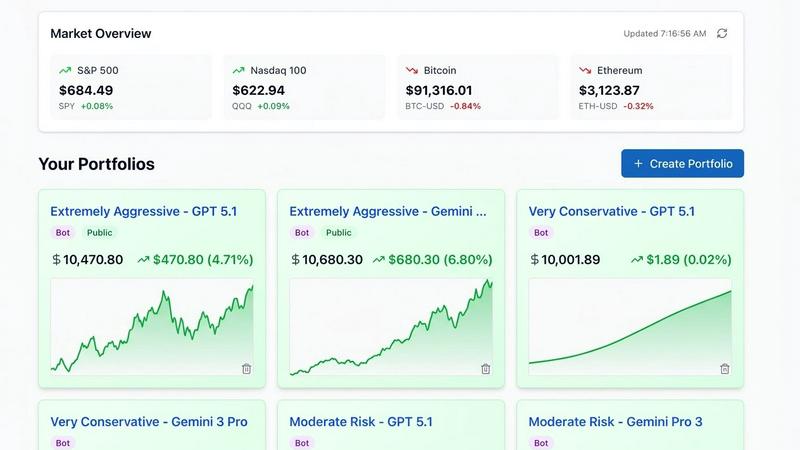
Unified Global Market Dashboard
Simplify your tracking by bringing all your investments together. This feature allows you to monitor stocks, ETFs, and cryptocurrencies from major exchanges worldwide in a single, streamlined dashboard. No more switching between multiple apps or websites. Get a comprehensive view of your entire diversified portfolio's performance at a glance.
Portfolio Diversification Visualizer
Achieving a balanced portfolio is key to smart investing. Portfolio Genius provides a clear, visual breakdown of your asset allocation across different sectors, industries, and asset classes. This easy-to-read chart helps you instantly see if your portfolio is too concentrated in one area, empowering you to make adjustments for better long-term stability.
Use Cases
Dividend Data
Analyzing Dividend Stocks
Investors can utilize Dividend Data to analyze a variety of dividend stocks. By using custom formulas, they can quickly access vital metrics such as dividend yields and payout ratios, which are crucial for evaluating potential investments.
Portfolio Management
Dividend Data allows users to track their dividend portfolios effortlessly. Investors can automatically link their portfolios to the tool, providing them with aggregate statistics and performance insights that save time and enhance decision-making.
Financial Research
With the AI-powered research assistant, users can conduct detailed financial analysis with ease. Dividend Data equips investors with the tools necessary to chat with the AI for insights, making complex analyses simpler and faster.
Historical Performance Review
Dividend Data's extensive historical information enables investors to review long-term performance trends of their investments. By examining past earnings and price histories, they can better understand how stocks have performed and strategize accordingly.
Portfolio Genius
The Beginner Investor Learning the Ropes
If you're new to investing, the market can feel overwhelming. Portfolio Genius acts as your patient tutor. You can chat with the AI to ask basic questions, understand why it makes certain suggestions, and explore different portfolio strategies risk-free. It's a safe, educational environment to build your confidence and knowledge before committing real money.
The Busy Professional Seeking Automation
For professionals with demanding careers, finding time to manage investments is tough. Portfolio Genius provides the perfect automated assistant. You can set your goals and risk tolerance, then let the AI monitor the markets and send you concise, actionable insights. For ultimate convenience, you can even enable auto-trading to execute strategies on your behalf.
The Hands-On Trader Seeking an AI Edge
Even experienced traders can benefit from a second opinion. Portfolio Genius serves as a powerful research assistant, scanning vast amounts of data and news that a human might miss. It can validate your ideas, highlight unseen risks in your portfolio, and suggest alternative opportunities, giving you a sophisticated advantage in your decision-making process.
The Portfolio Reviewer Needing Clarity
Do you have existing investments scattered across different accounts? Portfolio Genius helps you consolidate and understand them. Simply input your holdings to get an instant, clear analysis of your overall asset allocation, performance, and risk exposure. It cuts through the clutter, providing a unified report that makes portfolio review simple and effective.
Overview
About Dividend Data
Dividend Data is a powerful tool that brings over 30 years of stock market data for more than 80,000 tickers directly into your Google Sheets and Microsoft Excel spreadsheets. Designed specifically for dividend and fundamental investors, it eliminates the need for API keys, coding, or tedious copy-pasting. With Dividend Data, you gain instant access to a wealth of information including dividends, yields, payout ratios, growth rates, financial statements, earnings, ratios, price history, and over 100 metrics. By simply typing a formula, you can pull live data into your spreadsheets, making it incredibly user-friendly. This tool is built by a dividend investor who understands the needs of fellow investors, ensuring that you have the resources necessary to make informed decisions without the high costs typically associated with institutional-grade data.
About Portfolio Genius
Welcome to Portfolio Genius, your friendly AI-powered partner for smarter investing. Think of it as having a personal investment advisor that works for you 24/7, making the complex world of stocks, ETFs, and crypto feel simpler and more approachable. Whether you're just starting to learn about the market or you've been trading for years, Portfolio Genius is designed to guide you every step of the way. It works by continuously analyzing your investment portfolio against live market data, financial news, and global trends. Then, it translates all that complex information into clear, data-driven insights and reasoned trade suggestions. This means you can make informed decisions with greater confidence, without needing to be a financial expert.
The tool is built for a wide range of investors. If you're a beginner, it provides educational guidance to help you learn as you go. For busy professionals, it offers an automated helping hand to manage your portfolio even when you're short on time. And for seasoned traders, it delivers that extra AI edge to spot opportunities you might have missed. You can interact with it through a simple chat interface, asking questions in plain language like you would a trusted friend. Plus, you get to choose your level of involvement: manually review its smart suggestions or enable auto-trading for a more hands-off approach. All your positions, trades, and performance are neatly organized in one easy-to-understand dashboard, giving you a clear picture of your financial journey.
Frequently Asked Questions
Dividend Data FAQ
How does Dividend Data integrate with Google Sheets and Excel?
Dividend Data integrates directly into Google Sheets and Microsoft Excel, allowing users to input specific formulas to retrieve live data without any coding or complex setups.
What kind of data can I access using Dividend Data?
With Dividend Data, you can access a wide range of stock market data including dividends, yield percentages, payout ratios, growth rates, financial statements, and over 100 additional metrics.
Is there a limit to the number of credits I can use?
Yes, the free tier provides you with 2,500 monthly credits. If you find that you need more data, you can explore additional pricing options available within the platform.
Who is Dividend Data designed for?
Dividend Data is specifically designed for dividend and fundamental investors who seek reliable, institutional-grade market data without the high costs associated with traditional financial services.
Portfolio Genius FAQ
Does Portfolio Genius provide investment advice?
No. Portfolio Genius is a portfolio tracking and analytics platform that provides educational and informational analysis on your investments. It offers data-driven insights and trade suggestions based on market data, but these are not personalized financial advice. All investment decisions are ultimately your responsibility.
How does the 7-day free trial work?
You can start a free trial of either the Lite or Premium plan with no commitment required. The trial gives you full access to all the features of your chosen plan for 7 days. If you decide it's not for you, you can cancel anytime during the trial period at no cost. No credit card is needed to start the trial for the demo.
Can I try Portfolio Genius without creating an account?
Yes! You can explore the core functionality without any sign-up. The "Create a Portfolio Without Signing Up" demo allows you to input hypothetical investment goals and an amount to see how the AI analyzes and constructs different portfolio compositions. This is a great way to experience the tool's value firsthand.
What is the Portfolio Leaderboards feature?
The Leaderboards are a unique and educational feature where you can watch AI-managed portfolios with different strategies (like Aggressive, Moderate, Conservative) compete in real-time. It's a fantastic way to learn by observing, compare various investment approaches, and see which strategies are performing best in current market conditions.
Alternatives
Dividend Data Alternatives
Dividend Data is a robust tool designed for dividend and fundamental investors, offering over 30 years of stock market data for more than 80,000 tickers directly in Google Sheets and Microsoft Excel. This service allows users to access a wealth of information, including dividends, yields, and financial metrics, without the need for coding or complex setups. As users explore their options, they often seek alternatives due to factors like pricing, specific features that may better suit their investment strategies, or preferences for particular platforms. When looking for an alternative, consider factors such as the availability of historical data, ease of use, and the range of metrics provided. It's also essential to assess whether the alternative meets your unique investment needs while ensuring that it integrates well with the tools you currently use. By focusing on these aspects, you can find a solution that enhances your investment analysis and decision-making process.
Portfolio Genius Alternatives
Portfolio Genius is an AI-powered investment advisor that helps manage your portfolio with smart analysis and automated trading suggestions. It falls into the category of automated investment platforms and robo-advisors, designed to simplify investing for everyone. People often look for alternatives for various reasons. You might be comparing pricing models, seeking different features like specific account types or integrations, or simply wanting to explore other platforms to find the best fit for your personal financial goals and comfort level. When evaluating alternatives, consider what's most important to you. Key factors include the platform's fee structure, the level of automation versus manual control, the quality of educational resources, the security of your funds and data, and the overall user experience. Finding a tool that aligns with your investment strategy and knowledge level is crucial.