Zelma

About Zelma
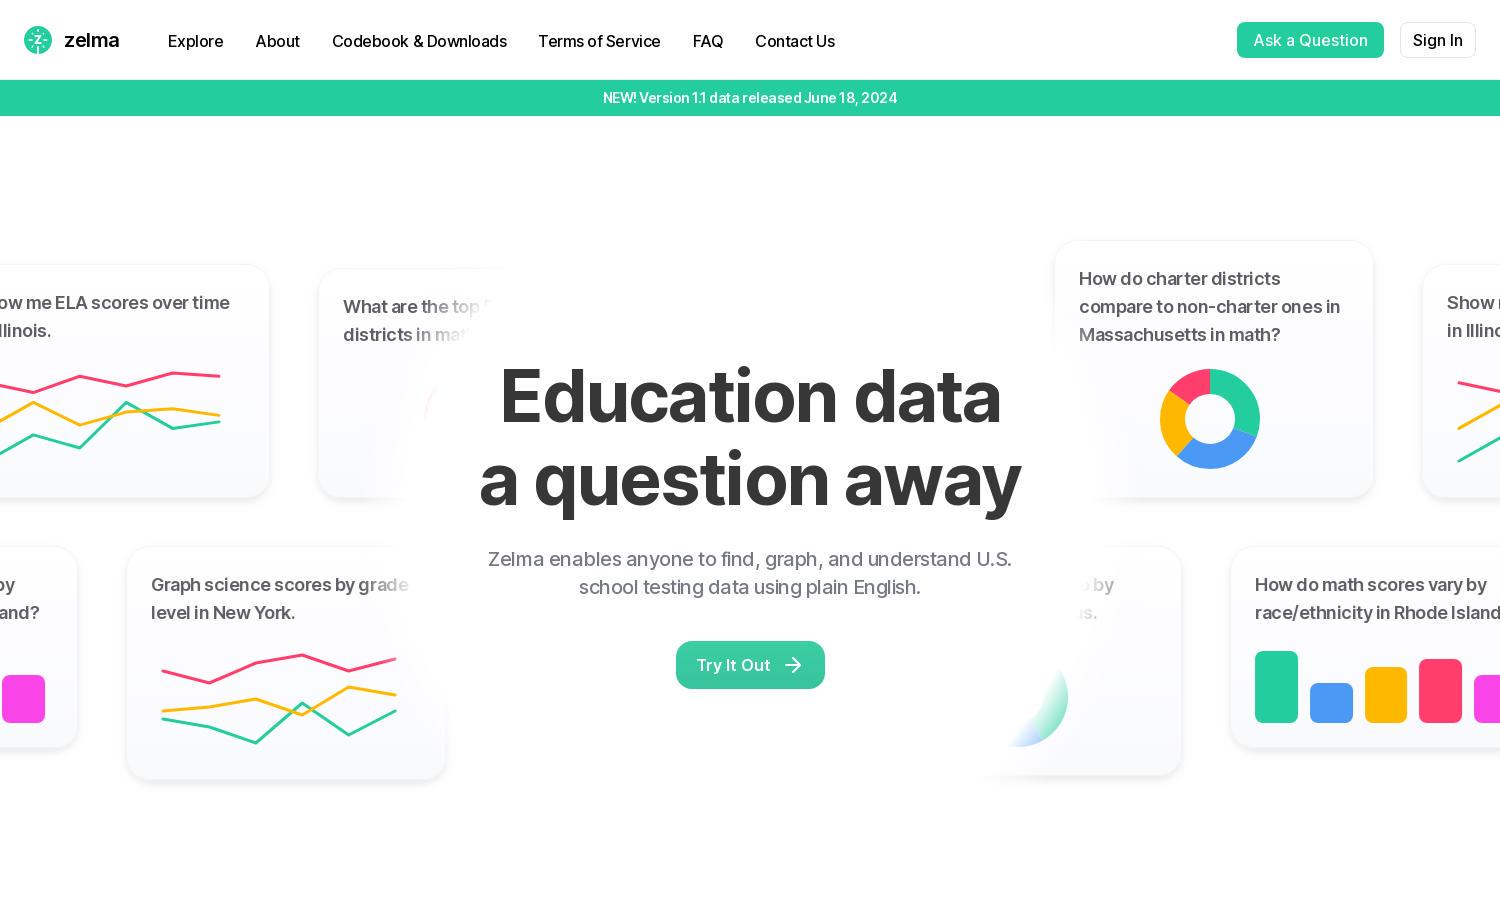
Zelma is an innovative educational tool that empowers users to explore U.S. school testing data effortlessly. By utilizing AI-driven responses, it allows educators, researchers, and policymakers to analyze performance metrics, trends, and demographics. Zelma simplifies data access, enabling informed decisions for improving education quality.
Zelma offers flexible pricing plans variously suited to users' needs. Options include individual and institutional subscriptions, featuring discounts for long-term commitments. Each tier provides increased data access and enhanced features, promoting a comprehensive understanding of student test data. Upgrading enhances insights and increases usability.
Zelma's user interface and design prioritize user experience with an intuitive layout and easy navigation. Users can quickly input queries and visualize results through interactive graphs and tables, making data analysis seamless and efficient. The clean, modern design of Zelma enhances engagement and exploration.
How Zelma works
Users interact with Zelma by signing up and inputting queries in plain English related to student test data. The AI processes these inquiries, delivering results through visualizations and tables that present clear data insights. The platform's ease of use empowers users to explore key educational metrics effectively.
Key Features for Zelma
AI-Driven Data Insights
Zelma features an AI-driven data insights tool that allows users to query complex education statistics in plain English. This unique feature simplifies accessing critical student test data, helping educators and researchers make informed decisions by utilizing comprehensive graphics and contextual information.
Comparative Performance Analysis
Zelma offers comparative performance analysis, enabling users to dissect testing data across various school districts. This feature allows educators and policymakers to evaluate and compare metrics such as math and ELA scores, fostering deeper understanding of educational disparities and facilitating targeted interventions.
Interactive Data Visualization
Zelma includes interactive data visualization tools, helping users transform raw student test statistics into understandable graphs and charts. This feature enhances the interpretation of complex data, allowing users to communicate insights effectively while making education data more accessible and engaging for decision-making.
You may also like:


